H-Graph FAQ
Everything you need to know about H-graphs.
There is, in fact, only one frequent question about H-graphs: you what?
In response to that, here is everything you need to know about H-graphs, namely
- what H-graphs are
- example H-graphs
- the point of H-graphs
- what each axis represents
- how to draw an H-graph using a computer
- how to draw an H-graph using pen and paper
- what Simple H-graphs are
- what Directional H-graphs are
- what Dynamic H-graphs are.
what H-graphs are
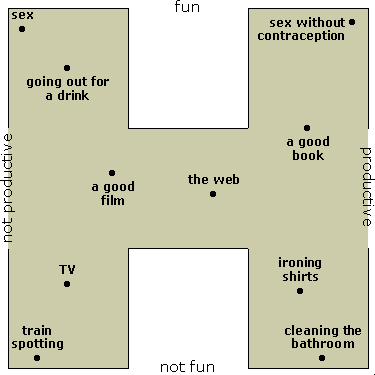
An H-graph is a diagram that shows the ratings of a collection of items for two independent criteria. That is, an H-graph is an easy way to show how much each item meets some pair of criteria. This is an H-graph.

In the example above a collection of activities is rated according to how much fun they are and, separately, how productive they are. Each item effectively has two scores that are not related.
example H-graphs
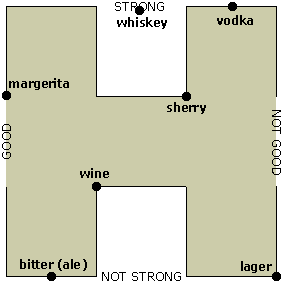
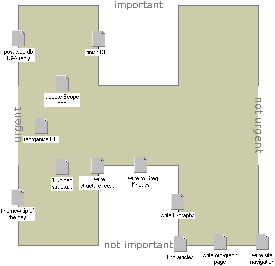
The original H-graph that inspired me was the Shiny vs Useful chart in one of suck.com fillers. Here's a (modified) screen grab of my own Task-Graph in use.
the point of H-graphs
If the items and their scores were represented textually it would be almost impossible to see at a glance how the items compare to each other. An ordered list, for example, would only show the ranking of one of the two criteria. In fact, I can't think of any other elegant way of displaying this information.
Most importantly, the two scores for each item are independent - the two axes of an H-graph emphasise this by allowing items in all four corners of the graph.
what each axis represents
A feature of H-graphs is the lack of units for the axes. The axes may represent more than a simple ranking, as the items need not be evenly spaced in each direction.
In the example above different horizontal positions can be thought of as different degrees of importance, from 0% important (not important) to 100% important, on the left. 'Importance' is a good example because it is a subjective measure - the items do not each have an intrinsic importance; rather, it is relative to other items' importance.
how to draw an H-graph using a computer
Obviously there is more than one way to draw an H-graph using a computer. There are three main approaches, each with its pros and cons.
- Drawing H-graphs with a bitmap image editor is not a very convenient solution in general. If you are using a package that has 'layers' such as Photoshop, though, then you can put the items on a separate layer to the background which makes it easier. The advantage of using a paint program is that it is simpler to produce bitmap pictures of H-graphs to put on web pages, say, as I have done above.
- The most flexible way to create H-graphs on a computer is to use a vector-based drawing program. Typically, this allows you to lock the background and to make each item on the graph a single draggable object. The disadvantage is that most drawing programs are overkill for this problem and that it may be a hassle to produce bitmap pictures.
- A completely different approach to computer-based H-graphs is to use the 'desktop', in MacOS or Windows, or the equivalent in other GUIs. The idea is that you set your desktop background colour to 50 per cent grey, and then centre the Urgent-Important graph on your desktop background. Then, you use desktop icons for the different items. This is good because you don't need extra software to use the graph and because it is very easy to use. Unfortunately, you can't copy the graph to another computer and the only way to make a picture of it is to do a screen grab.
how to draw an H-graph using pen and paper
The best way of putting an H-graph on paper is to use yellow stickies on top of a big sheet of paper that has the graph axes on it. Using a yellow sticky for each item is essential so that you can move it 'up a bit', say, and so that it then stays where you put it. This approach is better than a printout of an H-graph drawn on a computer: that's just a picture of an H-graph - you cannot actually use it.
what Simple H-graphs are
A Simple H-graph is an H-graph that does no more than rank the items in order for each of the two criteria, with shared rankings allowed. This is the same as saying that on a a Simple H-graph the items are horizontal spacings are equal and the items' vertical spacings are equal. For example:

what Directional H-graphs are
A directional H-graph is one where each node has a direction, usually indicated by drawing an arrow from the node. The direction generally indicates a trend - which way the item is expected to move over time.
what Dynamic H-graphs are
A Dynamic H-graph is just an animated directional H-graph. To put it another way, it is an H-graph where each item has an associated (directed) velocity as well as a position. This would be useful on a Task-Graph, because then you could have automatic escalation of urgency or importance.


