Inspecting HTTP client requests
Four easy tools for debugging web services 2014-08-28 #programming
When you’re developing web services, you often need to debug HTTP requests between a custom client and a server-side endpoint URL. An important first step is to isolate the client, to check that it sends the correct HTTP requests. Sometimes, it is important to be able to do this without using the server, perhaps because you haven’t built it yet, or because it is broken.
To inspect HTTP client requests, you need a server that will let you inspect the raw requests that it receives from your client. It turns out that there are several ways to do this without without having to install any software or write any code.
Sending JSON via HTTP POST
As a simple example, suppose you are debugging a web service that requires clients to send the following JSON object via HTTP POST.
{
 "quantity": 11,
 "mood": "elated",
 "animal": "elephants"
}
To try this out, save this JSON in a test.json file and send it to a server URL using cURL on the command line:
curl -X POST -H "Content-Type: application/json" --data-binary @test.json http://localhost:9000/
When you run this, you’ll get a connection error because there is no server:
curl: (7) Failed connect to localhost:9000; Connection refused
The next step is to try a few different servers that will accept the connection, and help you to debug the HTTP request.
netcat
The simplest available tool for inspecting HTTP requests is netcat - called nc on the Unix command line. You can use netcat to listen for TCP connections on a specified port and echo the data it receives. Run it on the command line:
nc -l 9000
If you run the cURL command again, you get the following output.
POST / HTTP/1.1
User-Agent: curl/7.30.0
Host: localhost:9000
Accept: */*
Content-Type: application/json
Content-Length: 62

{
 "quantity": 11,
 "mood": "elated",
 "animal": "elephants"
}
This is the raw HTTP request, and might be enough for debugging purposes. However, this only lets you check the raw client request, not how the client handles an HTTP response.
netcat isn’t an HTTP server, so it doesn’t send an HTTP response to the client. If you need that for debugging, then you’ll need a different kind of tool, such as Mocky.
Mocky
www.mocky.io is a web application that lets you specify an HTTP response, and generates an endpoint that returns this response.
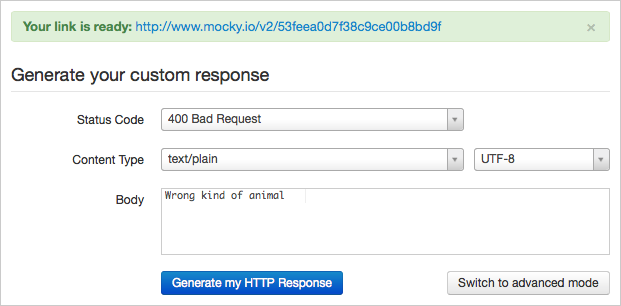
The screenshot shows a Mocky endpoint that returns a 400 Bad Request response. To see this, use cURL with the --include option to include HTTP response headers in the output:
curl --include -X POST -H "Content-Type: application/json" --data-binary @test.json http://www.mocky.io/v2/53feea0d7f38c9ce00b8bd9f
The response is now:
HTTP/1.1 400 Bad Request
Server: Cowboy
Date: Thu, 28 Aug 2014 08:46:35 GMT
Connection: keep-alive
Content-Type: text/plain; charset=utf-8
Content-Length: 20
Via: 1.1 vegur

Wrong kind of animal
This is very convenient, and easy to use, but unfortunately Mocky doesn’t give you a way to inspect the HTTP request. For that, you need something more sophisticated, like RequestBin.
RequestBin
RequestBin is a web application that, like Mocky, generates an endpoint for you to use. There is no configuration: just click the Create a RequestBin button on the home page. This creates a new ‘RequestBin’, which has a URL that you can send requests to, and a web page that initially shows sample code for sending a POST request. The first of these examples is a cURL command line:
curl -X POST -d "fizz=buzz" https://epw176o.x.pipedream.net/
Run this command and reload the inspector page - the endpoint URL with ?inspect appended - to see something like this:
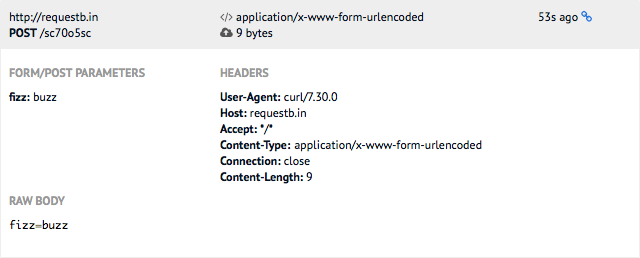
This shows FORM/POST PARAMETERS separately: RequestBin is intended for debugging HTML form requests. However, you can also use the JSON example:
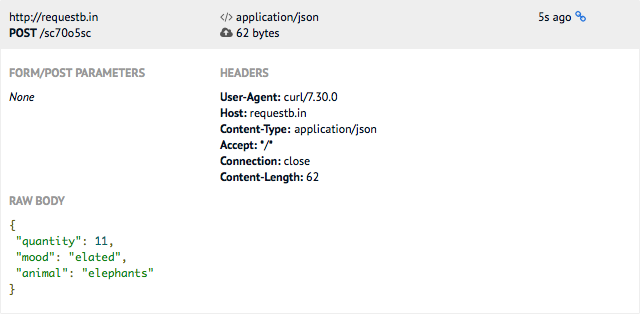
curl -X POST -H "Content-Type: application/json" --data-binary @test.json https://epw176o.x.pipedream.net/
This time the RAW BODY shows the raw JSON request, with syntax highlighting:
In both cases, RequestBin returns an HTTP 200 OK response. If you want more control over the response, then try httpbin.
httpbin
httpbin is similar to RequestBin but provides more endpoints and has a different kind of interface. You can also run it locally if you prefer.
To debug the JSON POST example, use the http://httpbin.org/post endpoint, which returns data from the HTTP POST request in the response:
curl -X POST -H "Content-Type: application/json" --data-binary @test.json http://httpbin.org/post
The HTTP response contains JSON data that echoes the information in the request:
{
  "args": {},
  "data": "{\n \"quantity\": 11,\n \"mood\": \"elated\",\n \"animal\": \"elephants\"\n}",
  "files": {},
  "form": {},
  "headers": {
    "Accept": "*/*",
    "Connection": "close",
    "Content-Length": "62",
    "Content-Type": "application/json",
    "Host": "httpbin.org",
    "User-Agent": "curl/7.30.0",
    "X-Request-Id": "5d587cd8-ca49-4979-b884-8df2d29cac89"
  },
  "json": {
    "animal": "elephants",
    "mood": "elated",
    "quantity": 11
  },
  "origin": "80.42.72.171",
  "url": "http://httpbin.org/post"
}
The data field shows the raw request data, but formatted as a JSON string, so this might be less useful for debugging the exact request body. However, the json field formats the request data as JSON, which could be very useful.
httpbin gives you more control over what the response is, by providing a number of other end points. For example, you can instruct it to return a 400 Bad request response:
curl --include -X POST -H "Content-Type: application/json" --data-binary @test.json http://httpbin.org/status/400
This gives the expected response:
HTTP/1.1 400 BAD REQUEST
Access-Control-Allow-Credentials: true
Access-Control-Allow-Origin: *
Content-Type: text/html; charset=utf-8
Date: Thu, 28 Aug 2014 09:53:00 GMT
Server: gunicorn/18.0
Content-Length: 0
Connection: keep-alive
Customising request inspection
Depending on the debugging you want to do, you might not get the exact information you need. At this point you might as well use your web framework of choice to implement a custom request logger, which shouldn’t take more than a few lines of code.
For example, with the Play Framework and Scala, you can do this as follows. First, create a new application, and replace the conf/routes file with a single route for POST requests:
POST / controllers.HttpLogger.log
Next add the controller, in app/controllers/HttpLogger.scala, with the code:
package controllers

import play.api.mvc._

object HttpLogger extends Controller {

  def log(path: String) = Action(parse.tolerantText) { request =>
    val headers = request.headers.toSimpleMap.toList.map(h => s"${h._1}: ${h._2}").mkString("\n")
    play.api.Logger.info("\n" + headers + "\n\n" + request.body)
    Ok
  }
}
Now you can run the application and send POST requests to http://localhost:9000/. This is as basic as it gets, but you can customise it to do anything you might want.

